Public health and safety are common topics for bicycle and pedestrian advocates. In this folder you will find resources on a variety of public health and safety issues including crash data, multi-use path crime statistics, health benefits of biking and walking, and the famous Power Point from the Centers for Disease Control & Prevention which show U.S. obesity trends over time.
Table of contents
Public Health
American Fitness Index Check out the 2009 American Fitness Index Report by the American College of Sports Medicine. This report gives a snapshot of health status at the metropolitan level. Download the report that pertains to your metropolitan area or look at the report as a whole. Data on biking and walking is included in the document.
American Fitness Index (PDF)
Economic Consequences of Obesity (CDC) This Center for Disease Control & Prevention website gives the national estimated cost of obesity and state-level estimated costs of obesity.
CDC - Economics of Obesity (URL)
F as in Fat: How Obesity Threatens America's Future (Trust for America's Health)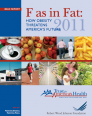 This annual report from the Trust for America's Health highlights the impact of the obesity epidemic and encourages active transportation and the adoption of complete streets policies.
F as in Fat: How Obesity Threatens America's Future (2011 - PDF)
F as in Fat: How Obesity Threatens America's Future (2010 - PDF)
Hidden Health Costs of Transportation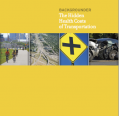 This report from the American Public Health Association outlines how vehicle-centric transportation decisions have negatively impacted public health. It provides examples that, not only demonstrate that health costs should be a significant factor in decision-making, but also show that calculating such costs is indeed possible.
The Hidden Health Costs of Transportation (URL)
The Health Risks and Benefits of Cycling in Urban Environments (Rojas-Rueda et al.)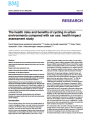 This August 2011 report set out to estimate the risks and benefits to health of travel by bicycle using a bicycle sharing scheme, compared with travel by car in an urban environment. Results found that public bicycle sharing initiatives like Bicing in Barcelona have greater benefits than risks to health and reduce carbon dioxide emissions.
The Health Risks and Benefits of Cycling in Urban Environments Compared with Car Use: Health Impact Assessment Study (PDF)(315KB)
Obesity Trends Among U.S. Adults - CDC MapsThis now famous Power Point presentation shows obesity trends among U.S. adults using colored maps. A powerful tool illustrating the obesity epidemic from the Center for Disease Control & Prevention.
Obesity Trends Among U.S. Adults (PPT) (1.24MB)
Walking, Cycling, and Obesity Rates in Europe, North America, and Australia
This article from the Journal of Physical Activity and Health examines the relationship between active transportation (walking, biking, and public transit) and obesity rates by conducting surveys from 1994 to 2006. Those countries with the highest levels of active transportation generally had lower obesity rates; 20 pages (338 KB).
Walking, Cycling, and Obesity Rates in Europe, North America, and Australia (PDF)
Safety
AutoVantage 2009 Road Rage Survey This 2009 article from AutoVantage on road rage in US cities highlights the most friendly cities for driving.
AutoVantage 2009 Road Rage Survey (PDF)(472KB)
Bicycle and Pedestrian Crash Maps (Los Angeles County Bicycle Coalition)![]() In 2011, the Los Angeles County Bicycle Coalition used traffic and demographic data to highlight the disproportionate risk of crashes for bicyclists and pedestrians in low-income communities in the LA region.
In 2011, the Los Angeles County Bicycle Coalition used traffic and demographic data to highlight the disproportionate risk of crashes for bicyclists and pedestrians in low-income communities in the LA region.
Bicycle and Pedestrian Crashes and Population Density (PDF)
Bike and Pedestrian Crashes and Median Household Income (PDF)
Bicycle and Pedestrian Crash Hotspots (PDF)
Bicycle Commuter Injury Prevention (Oregon Health Sciences University) This 2010 study from the Oregon Health Sciences University tracked bike commuters and monitored the types and severity of injuries they received during a one-year period. According to the study: "Approximately 20 percent of bicycle commuters experienced a traumatic event and 5 percent required medical attention during one year of commuting. Traumatic events were not related to rider demographics, safety practices, or experience levels. These results imply that injury prevention should focus on improving the safety of the bicycle commuting environment."
Bicycle Commuter Injury Prevention: It Is Time to Focus on the Environment (PDF)
Crashstat.org (Transportation Alternatives) Transportation Alternatives' pedestrian and bicycle crash maps and analysis website.
Crashstat.org (URL)
Dangerous By Design 2011 (Transportation for America) May 25, 2011. An update to the 2009 report by the same name, this release uses a Pedestrian Danger Index (PDI) to rank the country's largest metropolitan areas according to their relative risk to walkers.
Dangerous By Design 2011 (PDF)(1.7MB)
Distracted Driving Article (Virginia Tech Transportation Institute) This 2009 article from the Virginia Tech Transportation Institute (VTTI) is about a study on cell phone use and distracted driving.
Distracted Driving Article (URL)
How Many Cyclists are Killed and Injured Each Year? (NHTSA)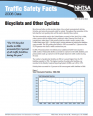 Statistics from National Highway Traffic Safety Administration from 2006.
How Many Cyclists Are Killed Each Year (PDF)
International Scan Summary Report on Pedestrian and Bicyclist Safety and Mobility (FHWA) From the Federal Highway Administration (FHWA), American Association of State Highway Transportation Officials (AASHTO) and National Cooperative Highway Research Program (NCHRP): In May 2009, a team of 12 transportation professionals with expertise in bicycling and walking from the United States visited five countries in Europe to identify and assess effective approaches to improve pedestrian and bicyclist safety and mobility. The scan team heard presentations from and had informal discussions with the foreign hosts. The scan team also went on field visits to better understand and experience the design and operation of various walking and bicycling facilities. These field visits were invaluable in documenting the facilities through photos and video, observing traffic behavior, and experiencing firsthand how well a design or operational strategy worked.
Pedestrian Bicycle Scan Summary Report (PDF)
Misconceptions: Crime (Transportation Alternatives)The report "Cars and Crime" is a comprehensive response to common misconceptions related to multi-use paths and is a study done on crimes in New York City's Prospect Park by Transportation Alternatives.
Misconceptions: Crime (TA) (PDF) (22KB)
Pedestrian Traffic Fatalities By State: 2010 Preliminary Data (Governors Highway Safety Association) This 2011 study, prepared for the Governors Highway Safety Association by Highway Safety North, shows that pedestrian fatalities are up very slightly (0.4 percent) for the first six months of 2010 as compared to the same time period in 2009, but forecasts that overall pedestrian fatalities for 2010 are 8 percent lower than 2009.
Pedestrian Traffic Fatalities By State 2010 (PDF)(594KB)
Places to Walk: Convenience and Regular Physical Activity (Powell et al.)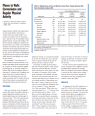 The availability and awareness of places conducive to physical activity are associated with higher levels of physical activity.This 2003 report used the Georgia Behavioral Risk Factor Surveillance System to determine (1) whether adult Georgians were aware of safe and convenient places for walking, (2) what places they most commonly envisioned, and (3) whether the proximity of those places was associated with self-reported physical activity behaviors.
Places to Walk: Convenience and Regular Physical Activity (PDF)(131KB)
Terminal Velocity: New York City's Speeding Epidemic (Transportation Alternatives)February 2009 report posted on Transportation Alternatives website. According to the report, "In 2008, Transportation Alternatives researchers recorded motorist speeds at 13 locations in all five boroughs. Using automated speed cameras and radar guns, the same equipment used by law enforcement professionals around the country, T.A. researchers measured the speeds of more than 15,000 motorists. Speeding is endemic on New York City streets. The study results show a staggering level of traffic crime that directly contributes to the deaths of pedestrians, bicyclists, drivers and passengers each year—a problem the City does not currently measure in the same way as violent crimes." 37 pages.
Terminal Velocity: New York City's Speeding Epidemic (PDF)(2.1 MB)
The Bay Citizen's Bike Accident Tracker (California Highway Patrol) This second edition tracking service provides data on bike crashes in the Bay Area and allows bikers to report their own accidents.
The Bay Citizen's Bike Accident Tracker (URL)
Traffic Safety Facts - 2009 Data (NHTSA)May 25, 2011. These fact sheets, released by the National Highway Traffic Safety Administration, provide data on the number of injuries and fatalities among pedestrians, bicyclists, and children in 2009. Statistics include specific information such as alcohol involvement in crashes, time and day of fatalities, statistics by age and sex, as well as other information.
2009 Traffic Safety Data - Pedestrians (PDF)(672KB)
2009 Traffic Safety Data - Bicyclists (PDF)(610KB)
2009 Traffic Safety Data - Children (PDF)(668KB)
Transportation Research Record: Bicycles, Pedestrians and Motorcycles This 2010 publication from the Transportation Research Board of the National Academies compiles 24 research papers from 2009 exploring bicycle and pedestrian safety issues.
Transportation Research Record: Bicycles, Pedestrians and Motorcycles (URL)
