 |
| Text, charts, and data in this article come from the Alliance's 2014 Benchmarking Report. Buy a copy of the 2014 Benchmarking Report here |
Providing opportunities for regular physical activity, such as walking and bicycling, can make a big impact on improving public health and life expectancy. [1] And we have the data to prove it.
The quantified health benefits of biking or walking for transportation can outweigh the risks by as much as 77 to 1. Biking and walking add more years to our lives than are lost from inhaled air pollution and traffic injuries. [2]
Our daily mode of travel has a great impact on our health as a society. Fifty percent of trips in the U.S. are three miles or shorter, and over 25% of our trips are less than one mile. Yet as many as 69% of those short trips are taken in private motorized vehicles. [3]
In comparison, only half of the U.S. population gets the recommended weekly amount of aerobic physical activity. One-third of the population is overweight and another one-third is obese. [4]
Active transportation not only improves our physical health, but also our mental well-being and ability to focus. [5] A recent study of Danish children showed that those who bicycled to school were better able to concentrate. In fact, walking and bicycling to school had a stronger impact on a child’s ability to focus than having breakfast and lunch. The physical activity associated with walking or bicycling to school advanced the child’s mental alertness to the equivalent of a student half a year further in their studies. [6]
In the Alliance for Biking & Walking's analysis of transportation and public health data, we found a strong relationship between statewide percentages of bicycling and walking to work and key public health indicators.
Here are 5 ways that biking and walking serve as public health indicators in the United States:
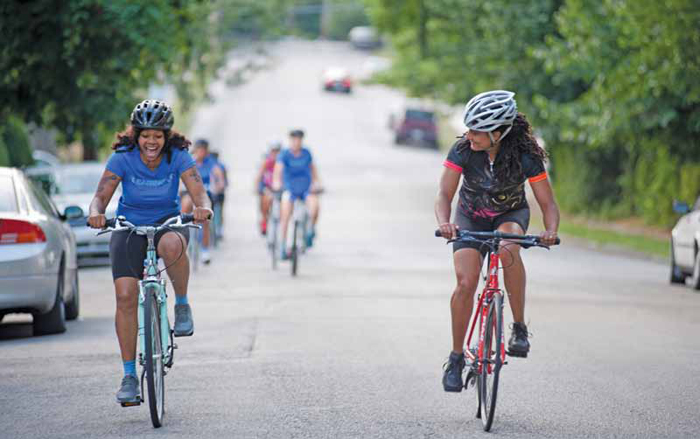
Image: Gearing Up / Alliance for Biking & Walking
1. Physical activity
In states with higher levels of bicycling and walking, higher levels of the population meet recommended weekly physical activity levels (r = 0.63).
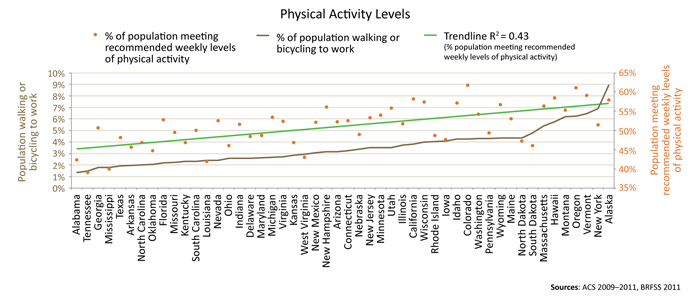
Of all states, Colorado and Oregon have the highest percentage of people meeting recommended physical activity levels, with bicycling and walking rates at 4.3% and 6.2% respectively. Tennessee, Mississippi, Louisiana, and Alabama have the lowest shares of people meeting the physical activity minimum. These states also all have bicycling and walking levels below the national average.
2. Obesity
States with higher levels of bicycling and walking to work see lower levels of obesity (r = -0.55).
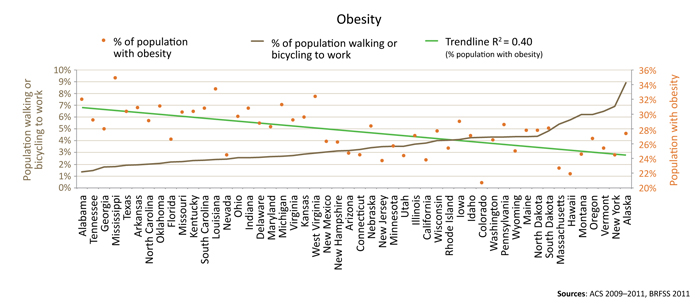
According to 2011 BRFSS statistics, 64% of the U.S. population is overweight or obese. Obesity alone (BMI over 30) affects more than one-fourth (28%) of the population. Among states, the percentage of obesity varies from 21% to 35%; in the large cities studied for this report, the percentage of obesity varies from 19% to 37%.
Memphis and Detroit have the highest levels of obesity among large cities (36.8% and 33.0% respectively), and some of the lowest city bicycling and walking to work rates (Memphis at 2.1% and Detroit at 3.4%). San Francisco and Oakland, by contrast, have the lowest combined obesity rate (18.6%) and above-average bicycling and walking rates (San Francisco at 13.1% and Oakland at 6.7%).
This correlation is not seen in all cities, however. New Orleans, Baltimore, Philadelphia, and Chicago are among the top 15 cities for commuters walking and bicycling to work, but they also have above-average levels of obesity among the most populous cities (31.6%, 30.0%, 26.9%, and 26.6%, respectively).
As an aside, it's worth noting that a person's body mass doesn't necessarily correlate with their overall physical health. Regular physical activity is a great practice to boost health at any weight. By ensuring that bicycling and walking are seamless parts of the transportation network, public officials can help people make more healthful choices about their own transportation.
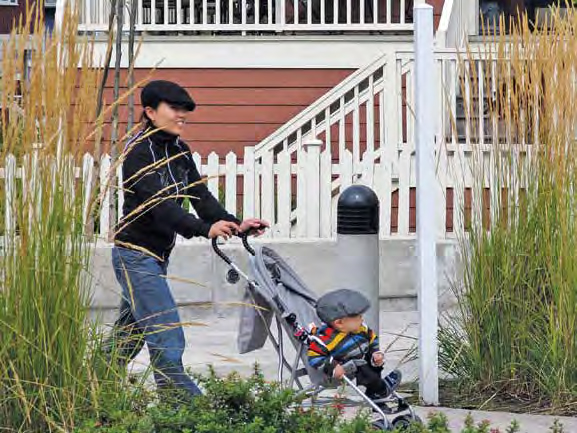
Image: Walkable and Livable Communities (WALC) Institute
3 & 4. High blood pressure and diabetes
States with higher levels of bicycling and walking to work see lower levels of diabetes (r = -0.70) and high blood pressure (r = -0.54).
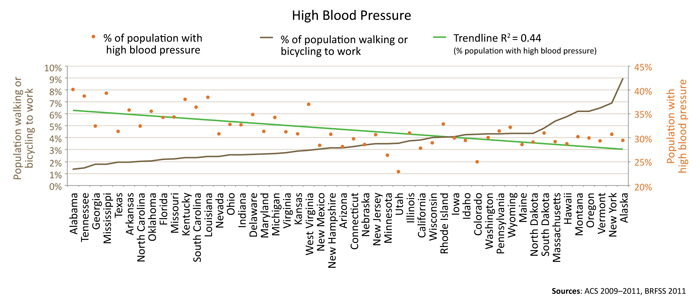
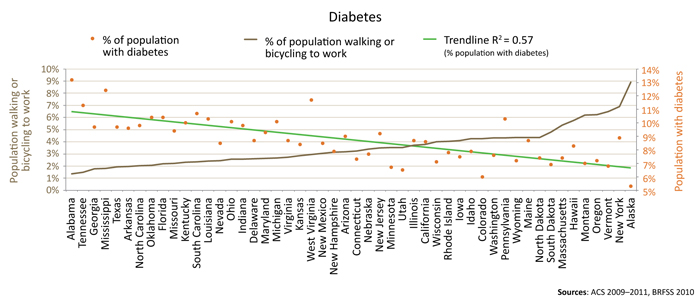
Nationally, 32% of Americans live with high blood pressure and 9% have diabetes. Mississippi and Alabama currently have the highest statewide levels of both high blood pressure (39% and 40%) and diabetes (12% and 13%). New Orleans and Memphis top the large city ranks for high blood pressure at 38% and 37% respectively. Memphis, El Paso, and Detroit have the highest levels of diabetes in the most populous cities, with 12-13% of residents in these cities living with diabetes.
These state and city data, as well as previous studies published in public health journals, confirm a strong and statistically significant inverse relationship between bicycling and walking commuter rates and both high blood pressure and diabetes in the United States. [7]
States with higher levels of bicycling and walking to work see lower levels of diabetes (r = -0.70), obesity (r = -0.55), and high blood pressure (r = -0.54), and see higher levels of the population meeting recommended weekly physical activity levels (r = 0.63).
5. Asthma
There are also environmental health aspects to consider. With a car-centric transportation system, polluted air leads to higher levels of asthma, lung cancer, heart disease, respiratory illness, and premature death. [8] The most harmful pollutants are emitted within minutes of starting a car, meaning that short trips pollute more per mile and have a bigger impact on our overall health than longer trips. [9] The most recent national health data report that 9% of adults in the U.S. live with asthma. [10]
Full data tables
Want to see how your community stacks up on public health indicators and active commuting? Find the full data tables for all 50 states, the 52 most populous U.S. cities, and 17 select midsized cities on pages 73, 74, and 86 of the 2014 Benchmarking Report.
Do you support better, safer biking and walking for healthier communities? Please consider sharing this.
| Share on Facebook |
References
[1] Buehler et al., 2011; Gordon- Larsen, 2009; Hamer and Chida, 2008; Oja, 2011; Pucher et al., 2010; Shephard, 2008
[2] Rojas-Rueda et al., 2011; Jacobsen and Rutter, 2012 in City Cycling
[3] National Household Travel Survey, 2009
[4] Behavioral Risk Factor Surveillance System, 2011
[5] Garrard et al., 2012 in City Cycling; Singh et al., 2012; Egelund, 2012; Chaddock et al., 2010; Hillman et al., 2005
[6] Egelund, 2012
[9] Federal Highway Administration, 2012
[10] Behavioral Risk Factor Surveillance System, 2010
