 |
| Text, charts, and data in this article come from the Alliance's 2014 Benchmarking Report. Buy a copy of the 2014 Benchmarking Report here |
Does everybody walk and bike, or are there differences in gender, income, age, and race?
In this excerpt from the 2014 Benchmarking Report, we take a look at who bikes and walks in the United States.
Share on Facebook TwitterHow much do people bike and walk?
First, it's important to understand where our data come from.
We have two main sources of information about who bikes and walks: the National Household Travel Survey (NHTS) and the American Communities Survey (ACS). (See a more in-depth look at the differences between the ACS and the NHTS here.)
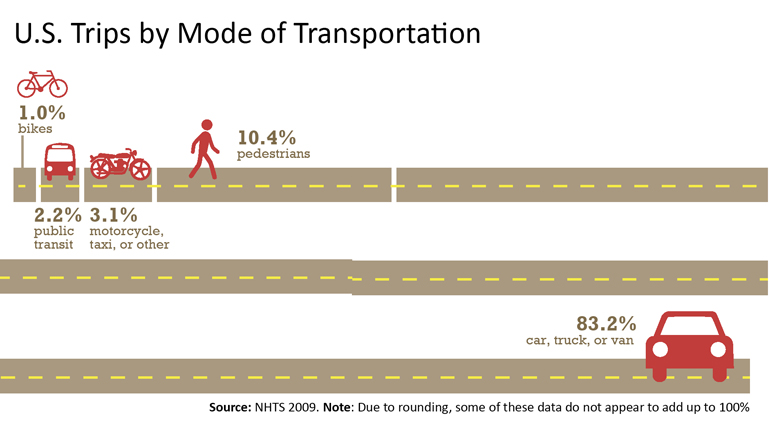
The NHTS asks Americans to keep a travel diary of all trips, then counts how people got around over a certain amount of time. NHTS data tells us a lot about mode share, but the survey is conducted irregularly and does not have a large enough sample size to warrant breaking down results by state and city. The 2014 Benchmarking Report uses data from the 2009 National Household Travel Survey.
Here's how United States trips broke down by mode of transportation, according to the 2009 NHTS:
The ACS, on the other hand, is conducted every year and incorporates feedback from a larger sample of Americans, but only asks about trips to work. The 2014 Benchmarking Report zeroes in on 2011 American Communities Survey data, the most recently available data when we began analysis.
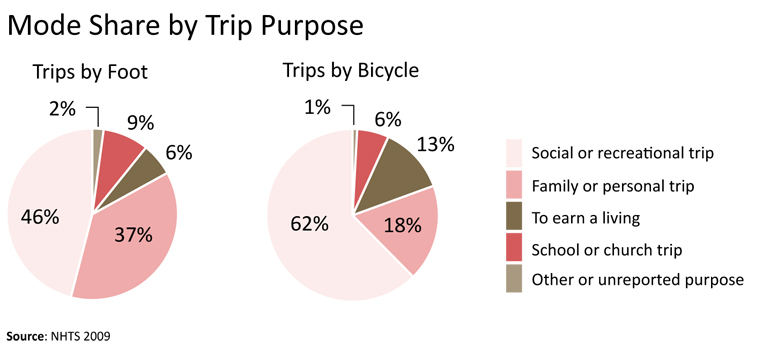
According to the National Household Travel Survey, a minority of walk and bike trips are trips "to earn a living." Work trips represent only 13% of bike trips and 6% of walking trips, which gives a sense of the number of walking and biking trips that the American Communities Survey misses.
Still, the American Communities Survey has some interesting data about who bikes and walks to work. Overall, the percentages of people commuting to work by bike and on foot are gradually increasing again, following a dropoff from 1990 - 2005.

Let's take a look at how some of these data break down by gender, age, income, and race / ethnicity.
Gender
Photo courtesty of BikeTexas
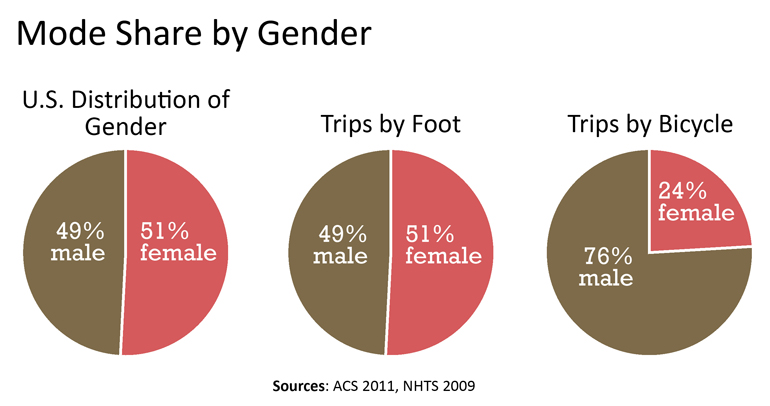
Who walks and bikes more: men or women? A look at national data show that walking trips are evenly split between genders, while bike trips remain weighted towards men.
The 2009 National Household Travel Survey showed that about 51% of walking trips were taken by women – reflective of the U.S. population as a whole. When it comes to biking, though, a gender gap clearly emerged: only 24% of bike trips were taken by women.
When it comes to commuting, walking trips are again evenly split by gender while biking trips remain disproportionately skewed towards men.
Women make up 46.5% of those who walk to work, which is roughly equivalent to the gender distribution of the work force. (ACS, 2011; DOL, 2010). The gender split of walking commuters varies by state and city; see page 47 of the 2014 Benchmarking Report for the full data table.
Bike trips are much more skewed: men make up 73% of bicycle commuters in the U.S. and 71% in large cities. As an overall trend, though, the gap between men and women bicycle commuters has been decreasing slightly as the overall bicycle commuter rate has increased. See page 47 of the 2014 Benchmarking Report for the full data tables about gender differences in bicycling to work.
Age
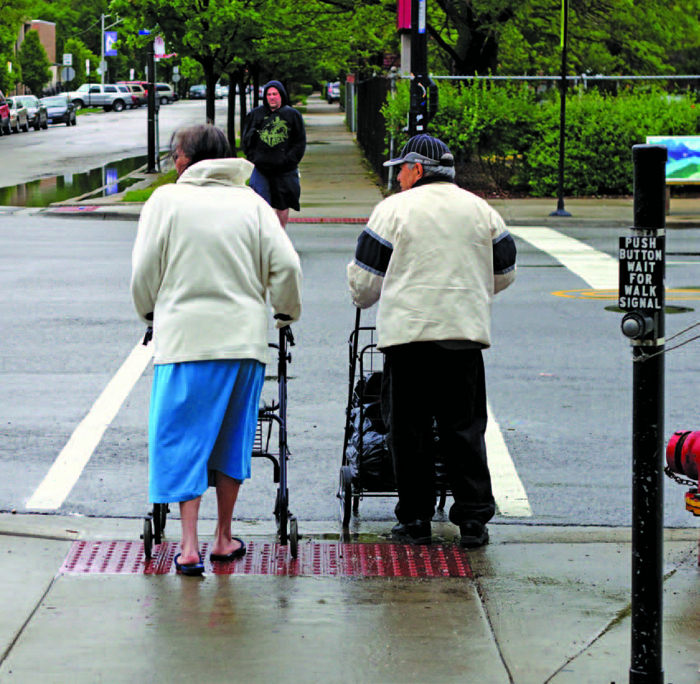
Seniors walking in Chicago, IL. Photo courtesy Josh Koonce / Flickr
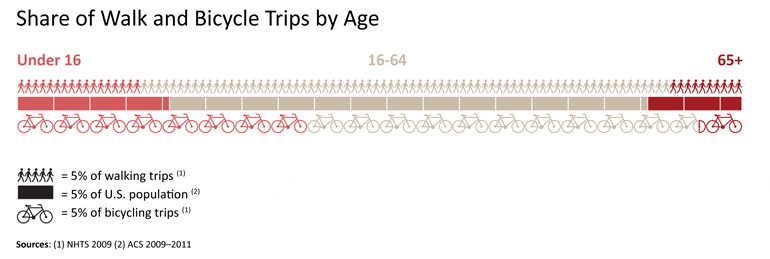
As might be expected, youth, who are not of legal driving age, make up a disproportionately high share of bicycling trips. Estimates from NHTS indicate that youth under age 16 make up 39% of bicycling trips, despite accounting for just 21% of the U.S. population. This age group also accounts for 17% of walking trips.
Adults age 65 and older represent 13% of the U.S. population and make up 10% of all walking trips and 6% of all bicycling trips. All other ages (16–64) make up 66% of the population and account for 73% of all walking trips and 54% of trips by bicycle.
Income
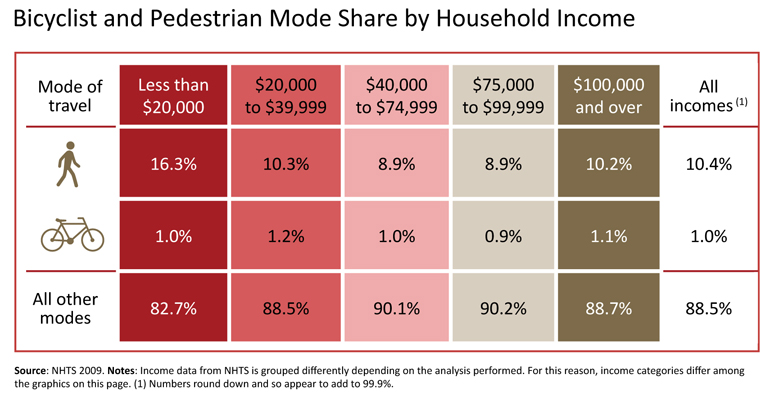
People across income groups walk and bicycle roughly proportionally to their distribution in the population.
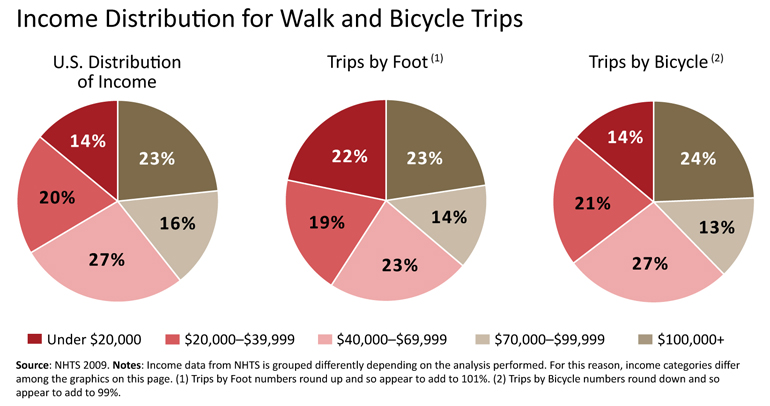
Pedestrian trips make up a higher percentage of all trips taken by people with an annual income of less than $20,000. The percentage of bicycle trips is similar across all income groups.
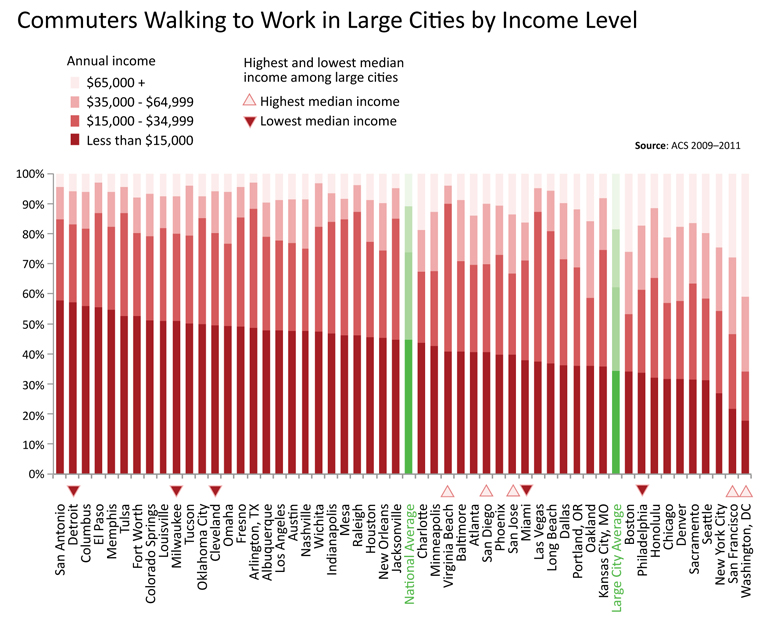
When it comes to commuting, though, lower income workers make up a disproportionate share of those who walk to work. Nationwide data from the American Communities Survey reveal that nearly 45% of people who walk to work earn less than $15,000 per year. On average, 62% of people who walk to work in large cities earn below $35,000 a year.
We're able to break down walk commute data by city. San Francisco and New York City show the most even income distribution among people who walk to work. Virginia Beach shows the most inequitable distribution, with 90% of pedestrian commuters making less than $35,000 per year. Washington, DC shows an unusual concentration of higher income commuters traveling by foot, with 41% of pedestrian commuters making over $65,000.
Unfortunately, we're not able to perform the same analysis for bike trips due to small sample sizes in many cities. For an in-depth look at gender and income differences among walking commuters in states and large cities, see pages 48 and 49 of the 2014 Benchmarking Report.
Race and Ethnicity
People of color commute to work by foot at higher rates than white workers. The ACS estimates 11% of commuters walking to work in 2011 were African American, and 18% of walking commuters were Hispanic. People who identify as white and non-Hispanic make up 61.7% of the U.S. workforce, but represent 53.1% of walking commuters.
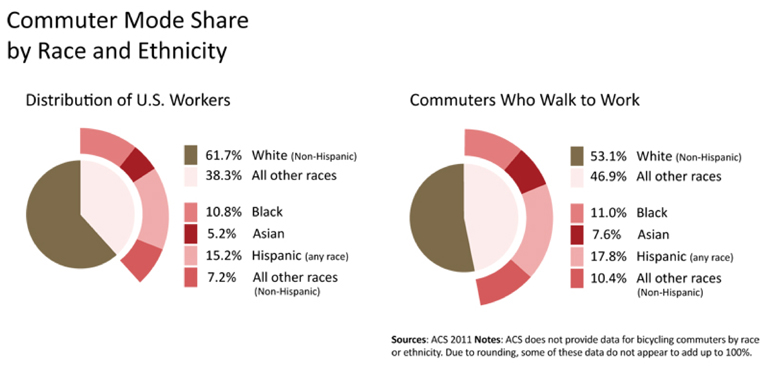
Because of small sample sizes, we could not complete a similar analysis for bicycle commute trips.
So there you have it – an overview, based on data from the 2014 Benchmarking Report, of who bikes and walks in the United States.
Any surprises? Join the conversation by sharing this post on social media:
| Share on Facebook |
