 |
| Data referenced in this article come from the Alliance's 2014 Benchmarking Report. Order the 2014 Benchmarking Report here |
Just in time for Halloween, a recent bicycle safety report from the Governors Highway Safety Association (GHSA) came with a spooky press release. "The number of bicyclists killed on U.S. roadways is trending upward," the presser warned.
Media outlets jumped to report the GHSA's conclusions: the LA Times led with the headline "Bicycle traffic deaths soar; California leads nation."
But there are some fundamental issues with the analysis that leads to these spooky conclusions.
Before we start number-crunching, let's examine the assumption that biking is an unsafe activity. In fact, the quantified health benefits of active transportation can outweigh any risks associated with these activities by as much as 77 to 1, and add more years to our lives than are lost from inhaled air pollution and traffic injuries (Rojas-Rueda et al., 2011; Jacobsen and Rutter, 2012).
And the numbers definitely don't tell as clear a story as the press release suggests.
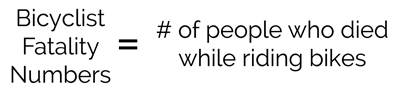
The new GHSA report looks at pure fatality numbers: the number of people who died while biking on U.S. roads in 2010, 2011, and 2012. That number did indeed see a slight uptick in 2012, but has been trending downwards overall: bicyclist fatalities decreased 30% (965 to 677) from 1980 to 2011.
But to understand bicycle safety, it is not enough to simply look at the number of fatalities. The level of bicycling in an area must also be taken into account to determine what the risk is. That's why, in our biennial Benchmarking Report, we pay closer attention to fatality rate.
Bicyclist fatality numbers tell us how many people died while riding a bike. The pure fatality numbers don't tell us anything about how many people were in the study population or how many people were riding generally.
A bicyclist fatality rate tells us how many people died as a proportion of the number of people who were riding a bike. When it comes to bicycle fatalities, this is a much more useful number, because it tells us about risk as compared to exposure.
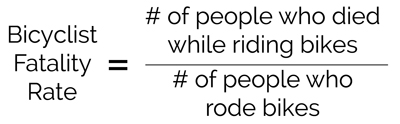
Imagine that last year in State A, 100 people biked to work and one person died while biking. Last year in State B, 6,000 people biked to work and two people died while biking. State B had more fatalities, but State A had a much higher fatality rate. The fatality risk is much higher in State A, even though there are more fatalities in State B. You're better off biking in State B, not State A.
Indeed, there is a reverse correlation between bicyclist fatalities and the rate of biking to work. This may sound counterintuitive, but actually makes a lot of sense: bike and walk fatalities tend to happen in crashes with vehicles, and drivers are more likely to operate carefully and safely around bikers when they're used to seeing people biking.
In the graph below, orange dots represent bicyclist fatality rates -- i.e., the number of people who have died while biking as a portion of the number of people who bike to work. The grey line indicates the percentage of the population who bikes to work, and the green line shows correlation between the two.

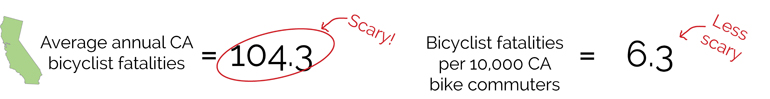
So when the LA Times writes that California has a huge number of bicyclist fatalities, they ignore two really important facts about California: (a) California has an enormous population and (b) California is home to lots of people who bike.
Our data, pulled from the 2014 Benchmarking Report, show that California had a lower than average bicyclist fatality rate based on three-year averages from 2009 to 2011. An average of 104.3 bicyclists died on California streets each year, which amounts to 6.3 bicyclist fatalities per 10,000 biking commuters.
On the other hand, states that seem perfectly safe for biking according to the GHSA report actually have pretty high fatality rates. Mississippi only had an average of 7 bicyclist fatalities per year from 2009 to 2011, but that works out to 70.4 fatalities per 10,000 bicyclists. Based on the rate, it's clear that Mississippi faces some more safety hurdles than California.

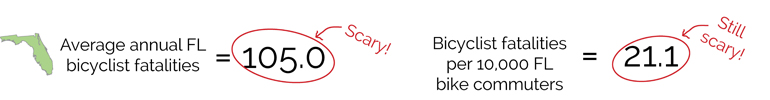
Of course, it's possible to have both high fatality numbers and high fatality rates. That's the case with Florida, where an average of 105.0 bicyclists lost their life per year, amounting to 21.1 bicyclist fatalities per 10,000 people commuting by bike.
(Note, too, that these numbers are based on three-year averages rather than yearly incremental changes. Because of the great fluctuations in fatality data from year to year, averages over several years are more reliable than annual numbers. Also, we use American Community Survey data to approximate the number of bike riders in a given state. ACS data has its limitations, but it's the best data we have.)
Hopefully, reporters and researchers will examine the context of active transportation safety numbers before jumping to conclusions about the relative safety of biking or walking.
Fortunately, the Governors Highway Safety Association does make some great recommendations about how states can work to improve bike safety.
Building protected bike lanes is a top suggestion in the GHSA report. Indeed, some states are already moving to approve design guidelines that add protected bike lanes to transportation departments' toolkits. Governor Jerry Brown of California just recently signed the Protected Bikeways Act, which will guide the state transportation department to create modern, protected bike lanes.
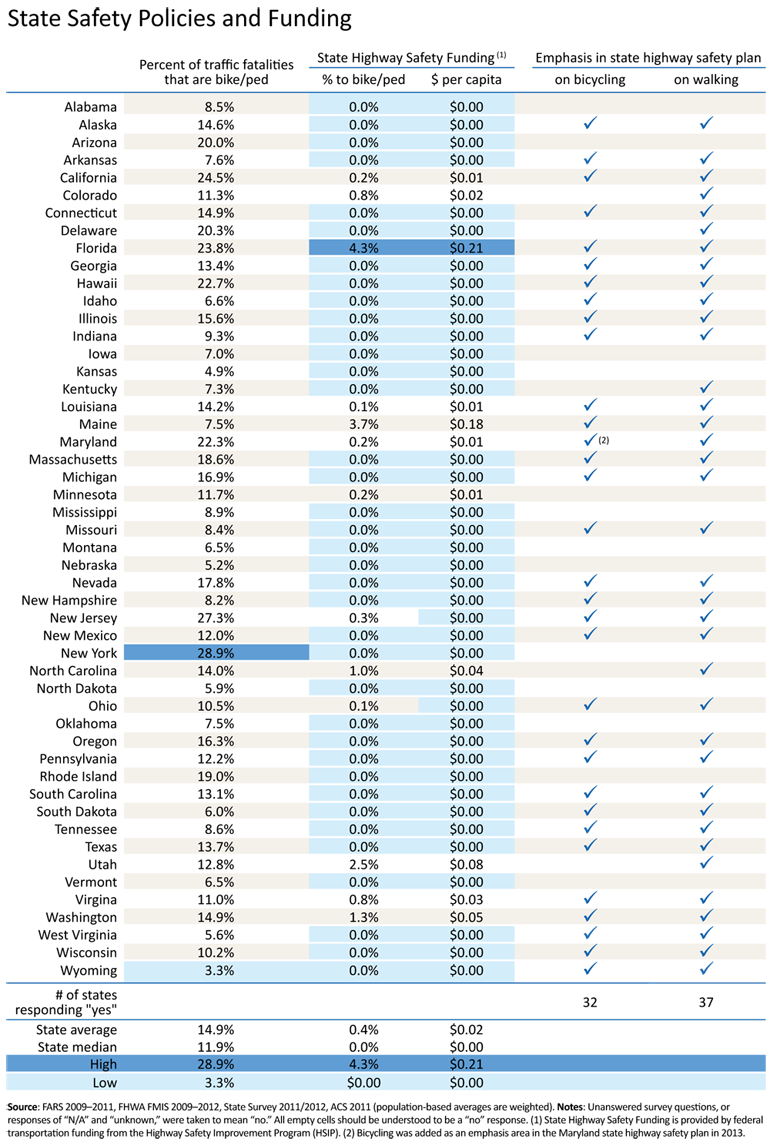
The GHSA would also do well to also recommend that states more proactively fund projects and programs to boost bike safety. There is significant federal funding available for bike and pedestrian safety measures through the Highway Safety Improvement Program (HSIP) within federal transportation law, and yet very few states have elected to use safety funds to pay for biking and walking improvements.
The GHSA is made up of the state and territorial highway safety offices that implement programs to address behavioral highway safety issues. These are the very offices that hold responsibility to spend available funds for safer biking and walking. And yet a quick glance at the below table shows that states spent an average of just 0.4% of Highway Safety Improvement Program funds on biking and walking safety – about two-tenths of a penny per person.
This is the really scary data – just in time for Halloween.