
Sign up here to get the weekly roundup in your inbox each and every Friday.
Giddyup! Please share this to spread the word about biking and walking advocacy.
| Share on Facebook | 
|
10 Fascinating Graphics to #StepItUp
Last week the Surgeon General announced a Call to Action to Promote Walking, amplifying our efforts, as advocates, to create communities that are safe and accessible for all modes of transportation. The support from a wide array of partners has been impressive, and here at the Alliance we have a particular tie to this exciting effort: Data from our biennial Benchmarking Report plays a significant role in the document and even helped set the statistical stage for the goals in the call to action.
Take Goal #5: “Fill surveillance, research, and evaluation gaps related to walking and walkability.” We recognize the importance of data to help advocates measure progress on bicycling and walking initiatives. That's why, in our Benchmarking Report, we collect and analyze the most recent data on bicycling and walking in all 50 states, the 50 largest U.S. cities, and a select number of other variously sized cities.
As the Call to Action kicks off, and with new data being released from the American Community Survey this week, we took a detour from our regular wrangling and rounded-up 10 fascinating graphics about walking from our 2014 Benchmarking Report. Stay tuned for our next edition of the Benchmarking Report coming in early 2016 and for a traditional Roundup next week!
1) Youth and older Americans account for a smaller percentage of walking trips than their distribution in the population
When comparing data from the National Household Travel Survey from 1969 to 2009, we see an enormous drop in the number of children biking and walking to school. In 1969, 48% of youth trips to school were by walking or biking, and only 12% were by car. By 2009, the situation had completely reserved to 45% of trips to school being taken by car and only 13% taken by foot or bicycle.
Today, youth (under 16 years) represent 21% of the U.S. population, but only 17% of all walking trips. Adults age 65 and older represent 13% of the U.S. population, but only 10% of all walking trips. These two age groups are not making as many trips by foot as the rest of the population.
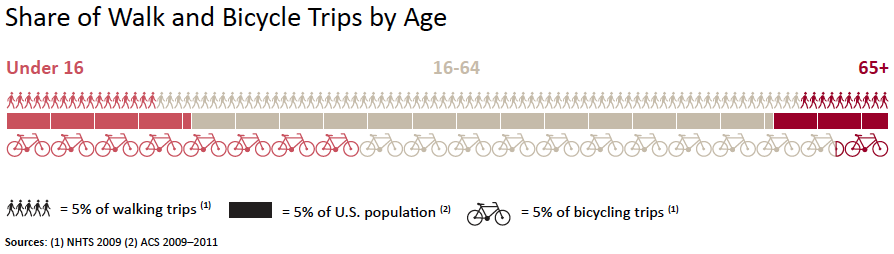
Source: 2014 Benchmarking Report, pg. 37
2) The percentage of commuters walking to work has remained constant.
Since the first Benchmarking Report was published in 2007, the percentage of commuters walking to work has hovered around 2.8% across the United States, and 4.9% in large U.S. cities.
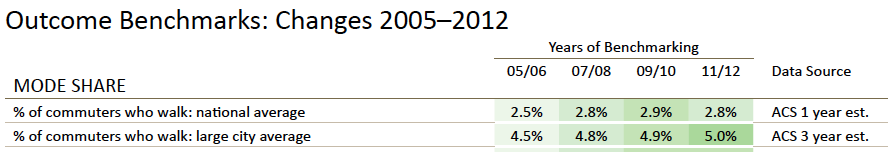
Source: 2014 Benchmarking Report, pg. 16
3) People of color walk to work more than their counterparts in the workforce
People of color are walking to work at higher rates than white workers. The American Community Survey estimates 11% of commuters who walked to work in 2011 were African American, and 18% of walking commuters were Hispanic. All races and ethnicities, other than those who identify as white, walk to work at disproportionately higher rates than their distribution in the population.
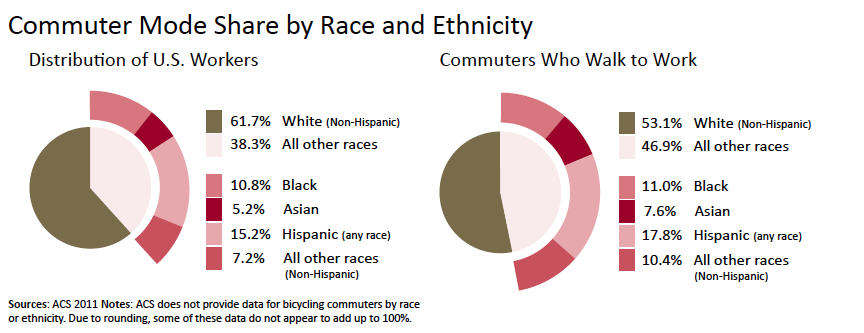
Source: 2014 Benchmarking Report, pg. 51
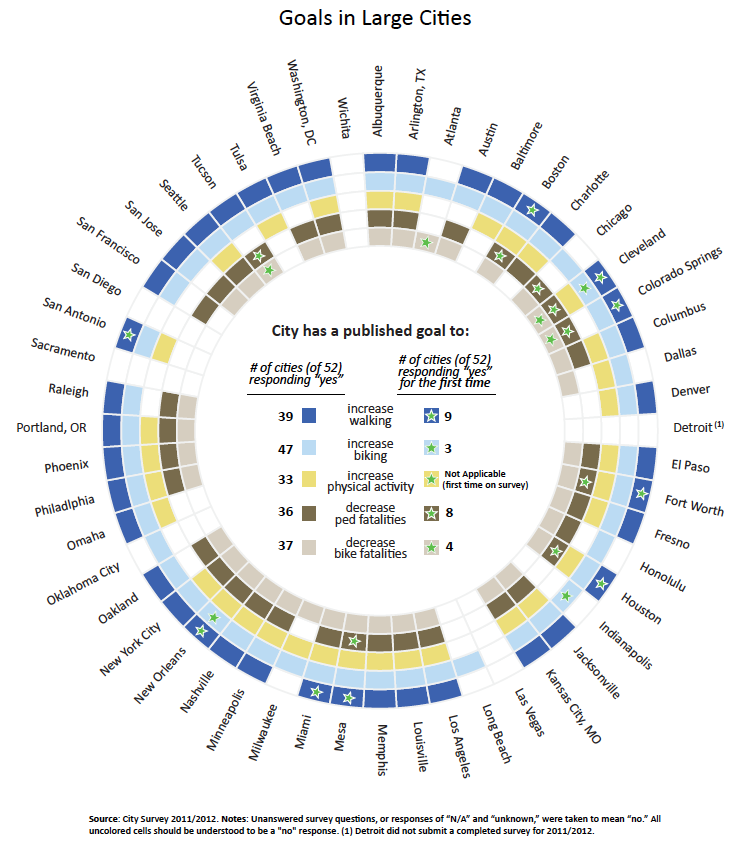
4) States and cities are increasingly setting goals to increase walking in their communities
When states or cities publish goals to increase walking and to decrease crashes, they are making public commitments to progress for which success can easily be measured.
In the 2014 Benchmarking Report, 35 states reported to have a goal to increase walking, compared to only 16 in the 2007 Report. Similarly, more cities have now adopted goals to increase walking. Of the 52 cities surveyed, 39 have goals to increase walking, compared to only 25 cities in the 2007 Report.

5) States and cities are increasingly adopting plans and policies that support walking in their communities
Of the 52 cities surveyed for the 2014 Benchmarking Report, 24 have either a combined bike/ped master plan, or both stand-alone biking and walking plans. In between the 2012 and 2014 Benchmarking Reports, there were 7 new pedestrian master plans, and 3 new combined bike/ped master plans.
Source: 2014 Benchmarking Report, pg. 108.
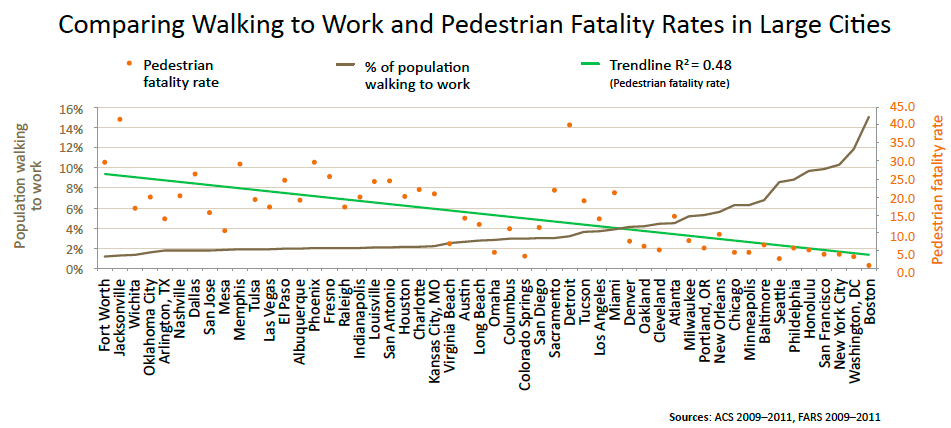
6) Cities where we walk more have lower pedestrian fatality rates
And, vice versa, cities with lower pedestrian fatality rates are places where people walk more. When comparing fatality rates in large cities to corresponding walking mode share, data show an inverse relationship between walking levels and fatality rates.
A possible explanation for this trend is that in cities where people are seen walking more often, drivers may be more aware of pedestrians along the road and at crossings. Likewise, infrastructure, such as signed routes and sidewalks, contribute to a perception of safety and may increase walking.
Source: 2014 Benchmarking Report, pg. 81
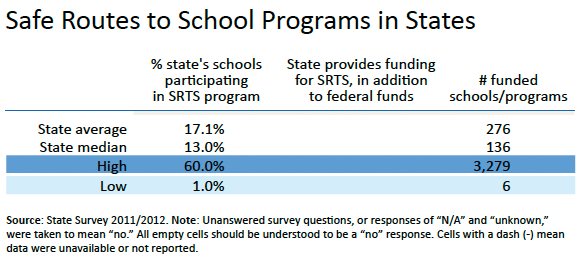
7) On average, only 17% of schools participate in Safe Routes to School programs
Safe Routes to School programs create safe, convenient, and fun opportunities for children to bike and walk to and from schools. In the 2014 Benchmarking Report survey, states reported that on average 17% of their public schools are engaged in a Safe Routes to School program. However, participation percentages range from less than 1% of schools (in Arkansas and South Dakota) to 60% of schools in Maine.
Source: 2014 Benchmarking Report, pg. 134
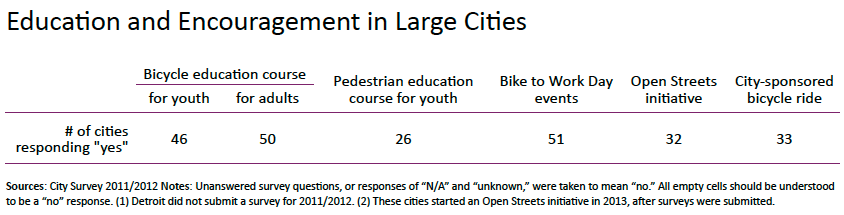
8) Most large cities have bicycle education courses available for youth, but only about half have pedestrian education courses available.
The 2014 Benchmarking survey found that 46 cities (88% of cities surveyed) have youth bicycle education courses. Only 26 cities (or 50%) have pedestrian education courses for youth. These education courses vary in that some are sponsored by the local government, some by a local nonprofit or advocacy organization, some by local hospitals or local bike shops, and others are the result of partnerships between multiple agencies.
Source: 2014 Benchmarking Report, pg. 184.
9) Only eight states sponsor walking events to promote walking and physical activity
Similarly, in the same Benchmarking Survey, 17 states noted that they had a state-sponsored bicycling event to promote bicycling and physical activity—while only 8 states had a state-sponsored walking event to promote walking. Those states are: Idaho, Illinois, Massachusetts, Missouri, Nevada, Texas, West Virginia, and Wisconsin.
Studies have shown that programs that promote biking and walking, such as Bike/ Walk to School days, Open Streets initiatives, and Safe Routes to School, have the ability to increase long-term healthy habits in participants.
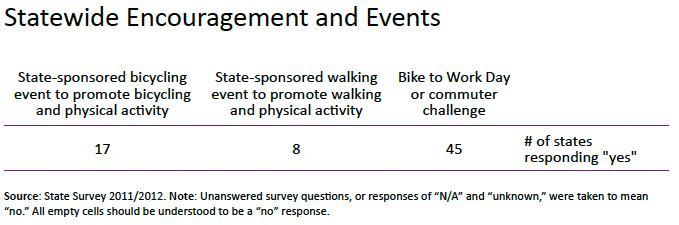
Source: 2014 Benchmarking Report, pg. 187.
10) Open Streets initiatives are becoming more prevalent
Open Streets initiatives, also known as Ciclovías, Sunday Streets, and Sunday Parkways, temporarily close streets to motorized traffic and open them for walking, jogging, bicycling, dancing, playing, and just about any other physical activity. Open Streets differentiate themselves from block parties and street fairs by promoting active living, and healthy lifestyle choices, and by connecting neighborhoods.
In 2014, there were nearly 100 Open Streets initiatives in the United States and Canada, up from only nine in 2005. These initiatives are located in all regions of the two countries.
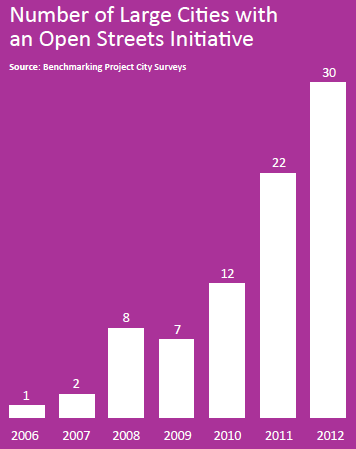 Source: 2014 Benchmarking Report, pg. 192
Read the Surgeon General's Call to Action to Promote Walking and Walkable Communities and learn more about the Benchmarking Project.
