Sign up here to get the biweekly roundup in your inbox every other Friday.
Giddyup! Please share this to spread the word about biking and walking advocacy.
| Share on Facebook |  |
9 Essential Intersections in Active Transportation
Over the past decade, the Benchmarking Report has tracked the slow but steady rise in walking and biking nationwide. It’s lifted the veil on data that helps us understand more fully where those gains are happening and where challenges remain. We know that rates of active transportation are a result of a complex set of factors that are unique in every state and community. In this edition of the Benchmarking Report, we explore many of those issue intersections — not only highlighting funding levels and policy passage but consider how different aspects of identity, environment and health impact mobility choices. In this edition of Roundup, we've wrangled 9 Essential Intersections from the 2016 Benchmarking Report that we hope you’ll be able to explore more deeply in your community.

Community Size & Mode Share
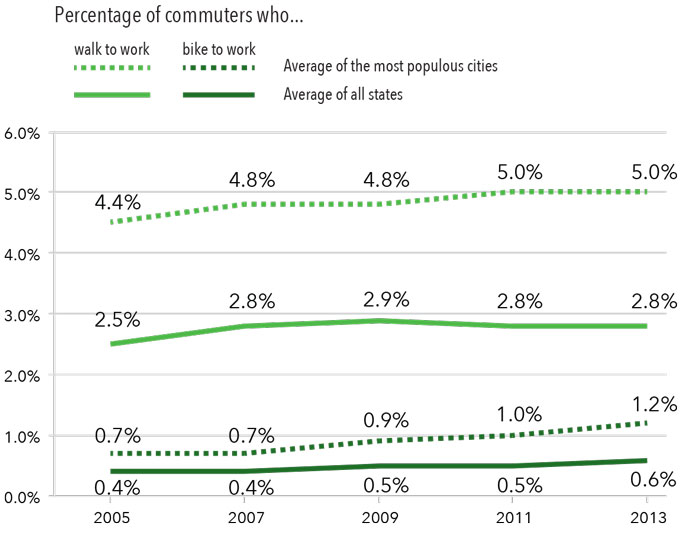
While biking and walking are seeing a steady increase in mode share nationwide, the most rapid advances are happening in cities— most notably the larger cities. For instance, among the most populous cities, the percentage of commuters walking to work has always been higher than the average across states. The large cities have also seen a steeper rise in bicycling, growing 71% from 2007 to 2013, compared to 50% for all states. But the trend toward active transportation has taken root in smaller and mid-sized cities, as well, with a number of the mid-sized cities surveyed for the report dramatically outpacing the largest cities.
Gender & Commuting
Women walk to work in relatively equal proportion to their percentage of all commuters. In fact, in the 50 most-populous cities women are slightly overrepresented, with females making up 49% of walking commuter and only 47% of overall commuters. That trend doesn’t hold for bicycling. Despite rising advocacy efforts to engage more female riders, even in the most-populous cities, women are vastly outnumbered by men, making up just 29% of commuters who bike.

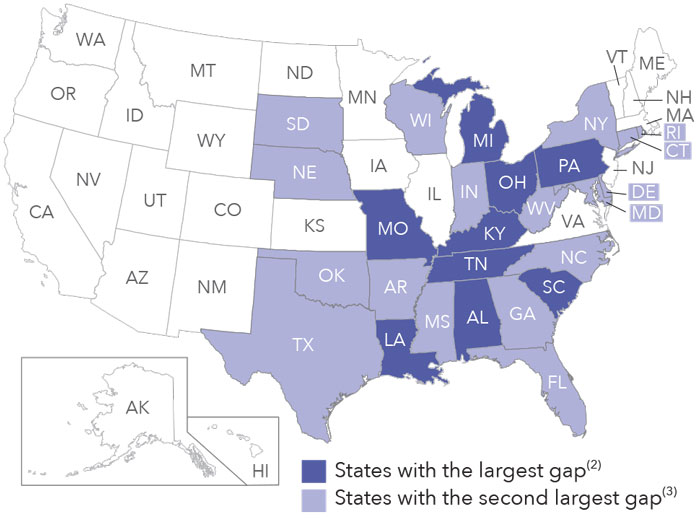
Race & Mobility
In most states, commuters of color represent a higher percentage of those who walk and use public transit than their representation within the total commuter population. The difference in distribution of people of color walking to work ranges between 13 percentage points below their distribution in the commuter population (in Hawaii) to 19 percentage points above their distribution (in Alaska). The difference in distribution of people of color taking transit to work varies from 3 (in Idaho and Maine) to 52 (in Missouri) percentage points above their distribution.
MAP: States where people of color are overrepresented in utilizing public transit compared to their representation among all commuters
Active transportation stakeholders are taking into account the intersections of identity and investments in impacting the ability or desire to walk and bike in different communities. For instance, a study found that black pedestrians are twice as likely to be passed in a crosswalk by a motorist than a white pedestrian. A 2012 survey found that 17% of Hispanic pedestrians “felt threatened for their personal safety” the last time they walked compared to 6% of white walkers, and that 35% of Native American respondents were dissatisfied with how their community was designed for bicycling — far about the average of 27%.
Age & Safety
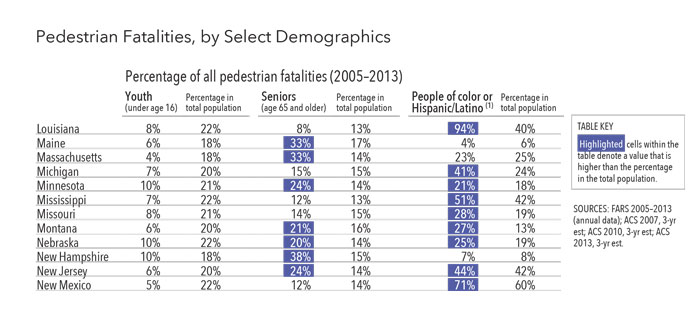
Like the 2014 report, the 2016 report shows a continued uptick in fatalities for people who walk or bike — and this burden falls disproportionately on low-income, seniors and people of color populations. In 36 states, a higher percentage of seniors are killed while walking than their representation in the general population.
While youth make up 21% of the population, they account for 39% of bike trips — but in 12 states youth are overrepresented among bicyclist fatalities than their representation in the general population. People of color are vastly overrepresented in bicyclist and pedestrian fatalities with 35 states showing higher rates than the general population for walking deaths and 18 states showing higher rates than the general population for bicycling deaths.
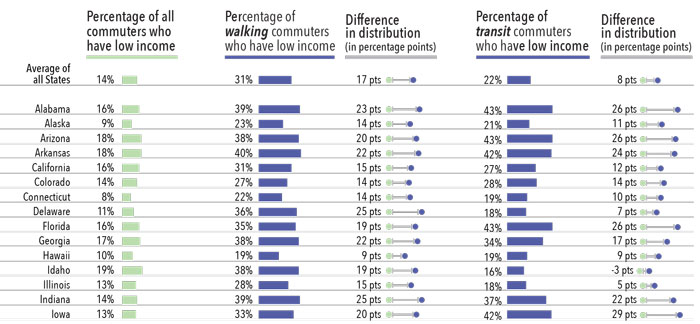
Income & Walking / Transit
In almost all states, commuters with low income represent a higher percentage of those who walk and use public transit than their representation within the total commuter population. On average, people of low income represent 14% of the commuter population, but are 31% of commuters who walk to work and 22% of commuters who take transit to work. The trips low-income households make by walking or biking are more likely to be for daily errands, work, school, or church than for social or recreational purposes.
Infrastructure & Access
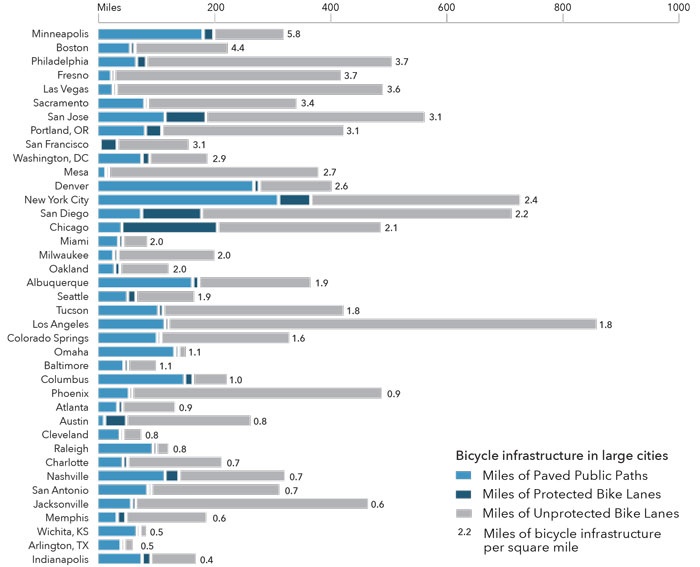
Infrastructure for biking and walking makes a big difference. A recent analysis of Safe Routes to Schools programs showed that engineering improvements for walking and bicycling were associated with an 18% relative increase of children walking or biking to school. Protected bike lanes have been shown to increase biking levels between 21–171%. Since 2005, the average bike facilities per square mile in the 50 most populous cities has doubled, from 0.9 to 1.8. In addition, 45 states have installed bike lanes on state highways and 20 have installed protected bike lanes.
As of 2013, only 39% of U.S. residents stated that they live within a quarter mile of a bike lane, while 32 percent of respondents stated that no streets in their neighborhood had sidewalks. And research has shown that, in some cities, low-income and communities of color have less access to bicycling and walking facilities than higher-income, white communities.
Health & Active Commuting
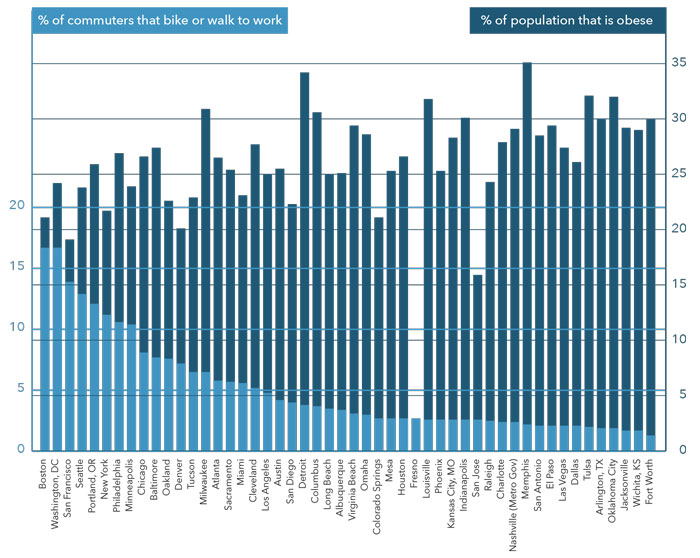
While a growing body of research has proven the health benefits of biking and walking, data from the states and cities continues to show a correlation between active transportation and critical health issues. States with higher levels of biking and walking generally show lower levels of diabetes, hypertension and obesity. However, dramatic health disparities persist in low-income and communities of color, increasing the urgency of equity of access to healthy transportation options.
State Policies & Bike/Walk Levels
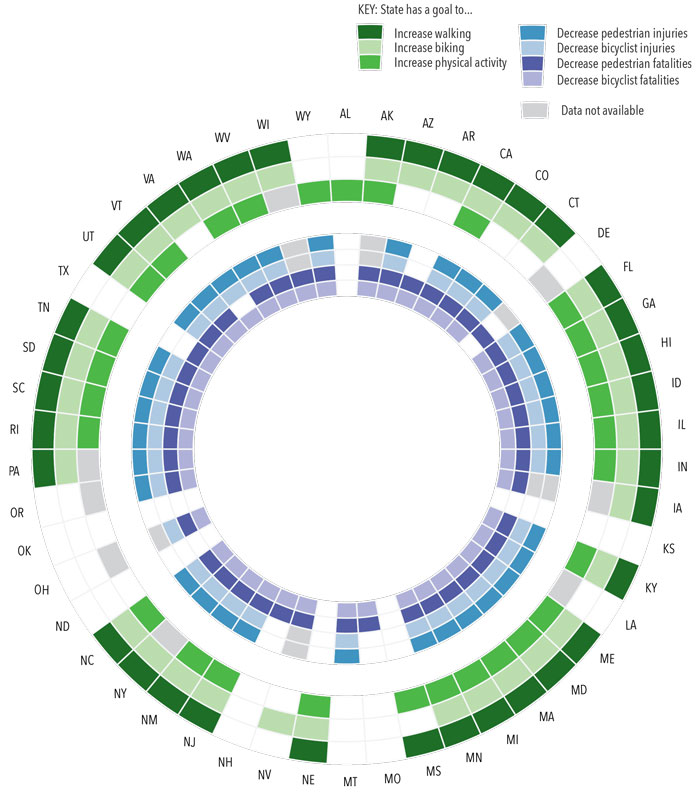
Recognizing the connection between access to active transportation and better health outcomes, a growing number of states and cities are setting goals to increase biking and walking — and improve health. The number of states with published goals to boost biking and walking has more than doubled from 16 states in 2007 to 36 states in 2015, and an impressive 47 of the 50 most populous cities now have a published goal to increase biking.
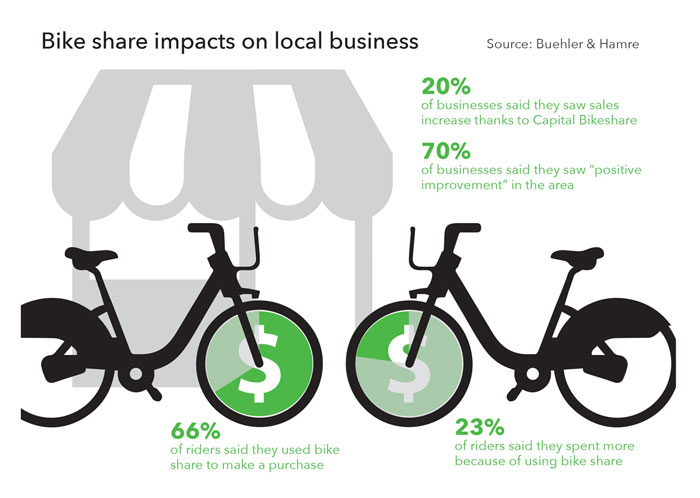
Economic Development & Biking
As policies like Complete Streets have markedly increased, states and cities have seen economic development benefits from their investment in biking and walking. For instance, a study of 10 Complete Streets projects found that 8 saw increased values for properties near the improved areas. A recent survey of businesses located near Capital Bikeshare (CaBi) stations in Washington, DC, found that 20% of businesses saw an increase in their sales, and 70% said they saw a “positive impact” on the surrounding area.
In recent years, however, there has been increased scrutiny of the economic development narrative, most notably regarding the role of infrastructure, such as bike lanes and bike share systems, in gentrification. This is an area worthy of continued conversation and partnership with allied movement in affordable housing and economic justice.
Advocate Capacity & Bike/Walk Improvements
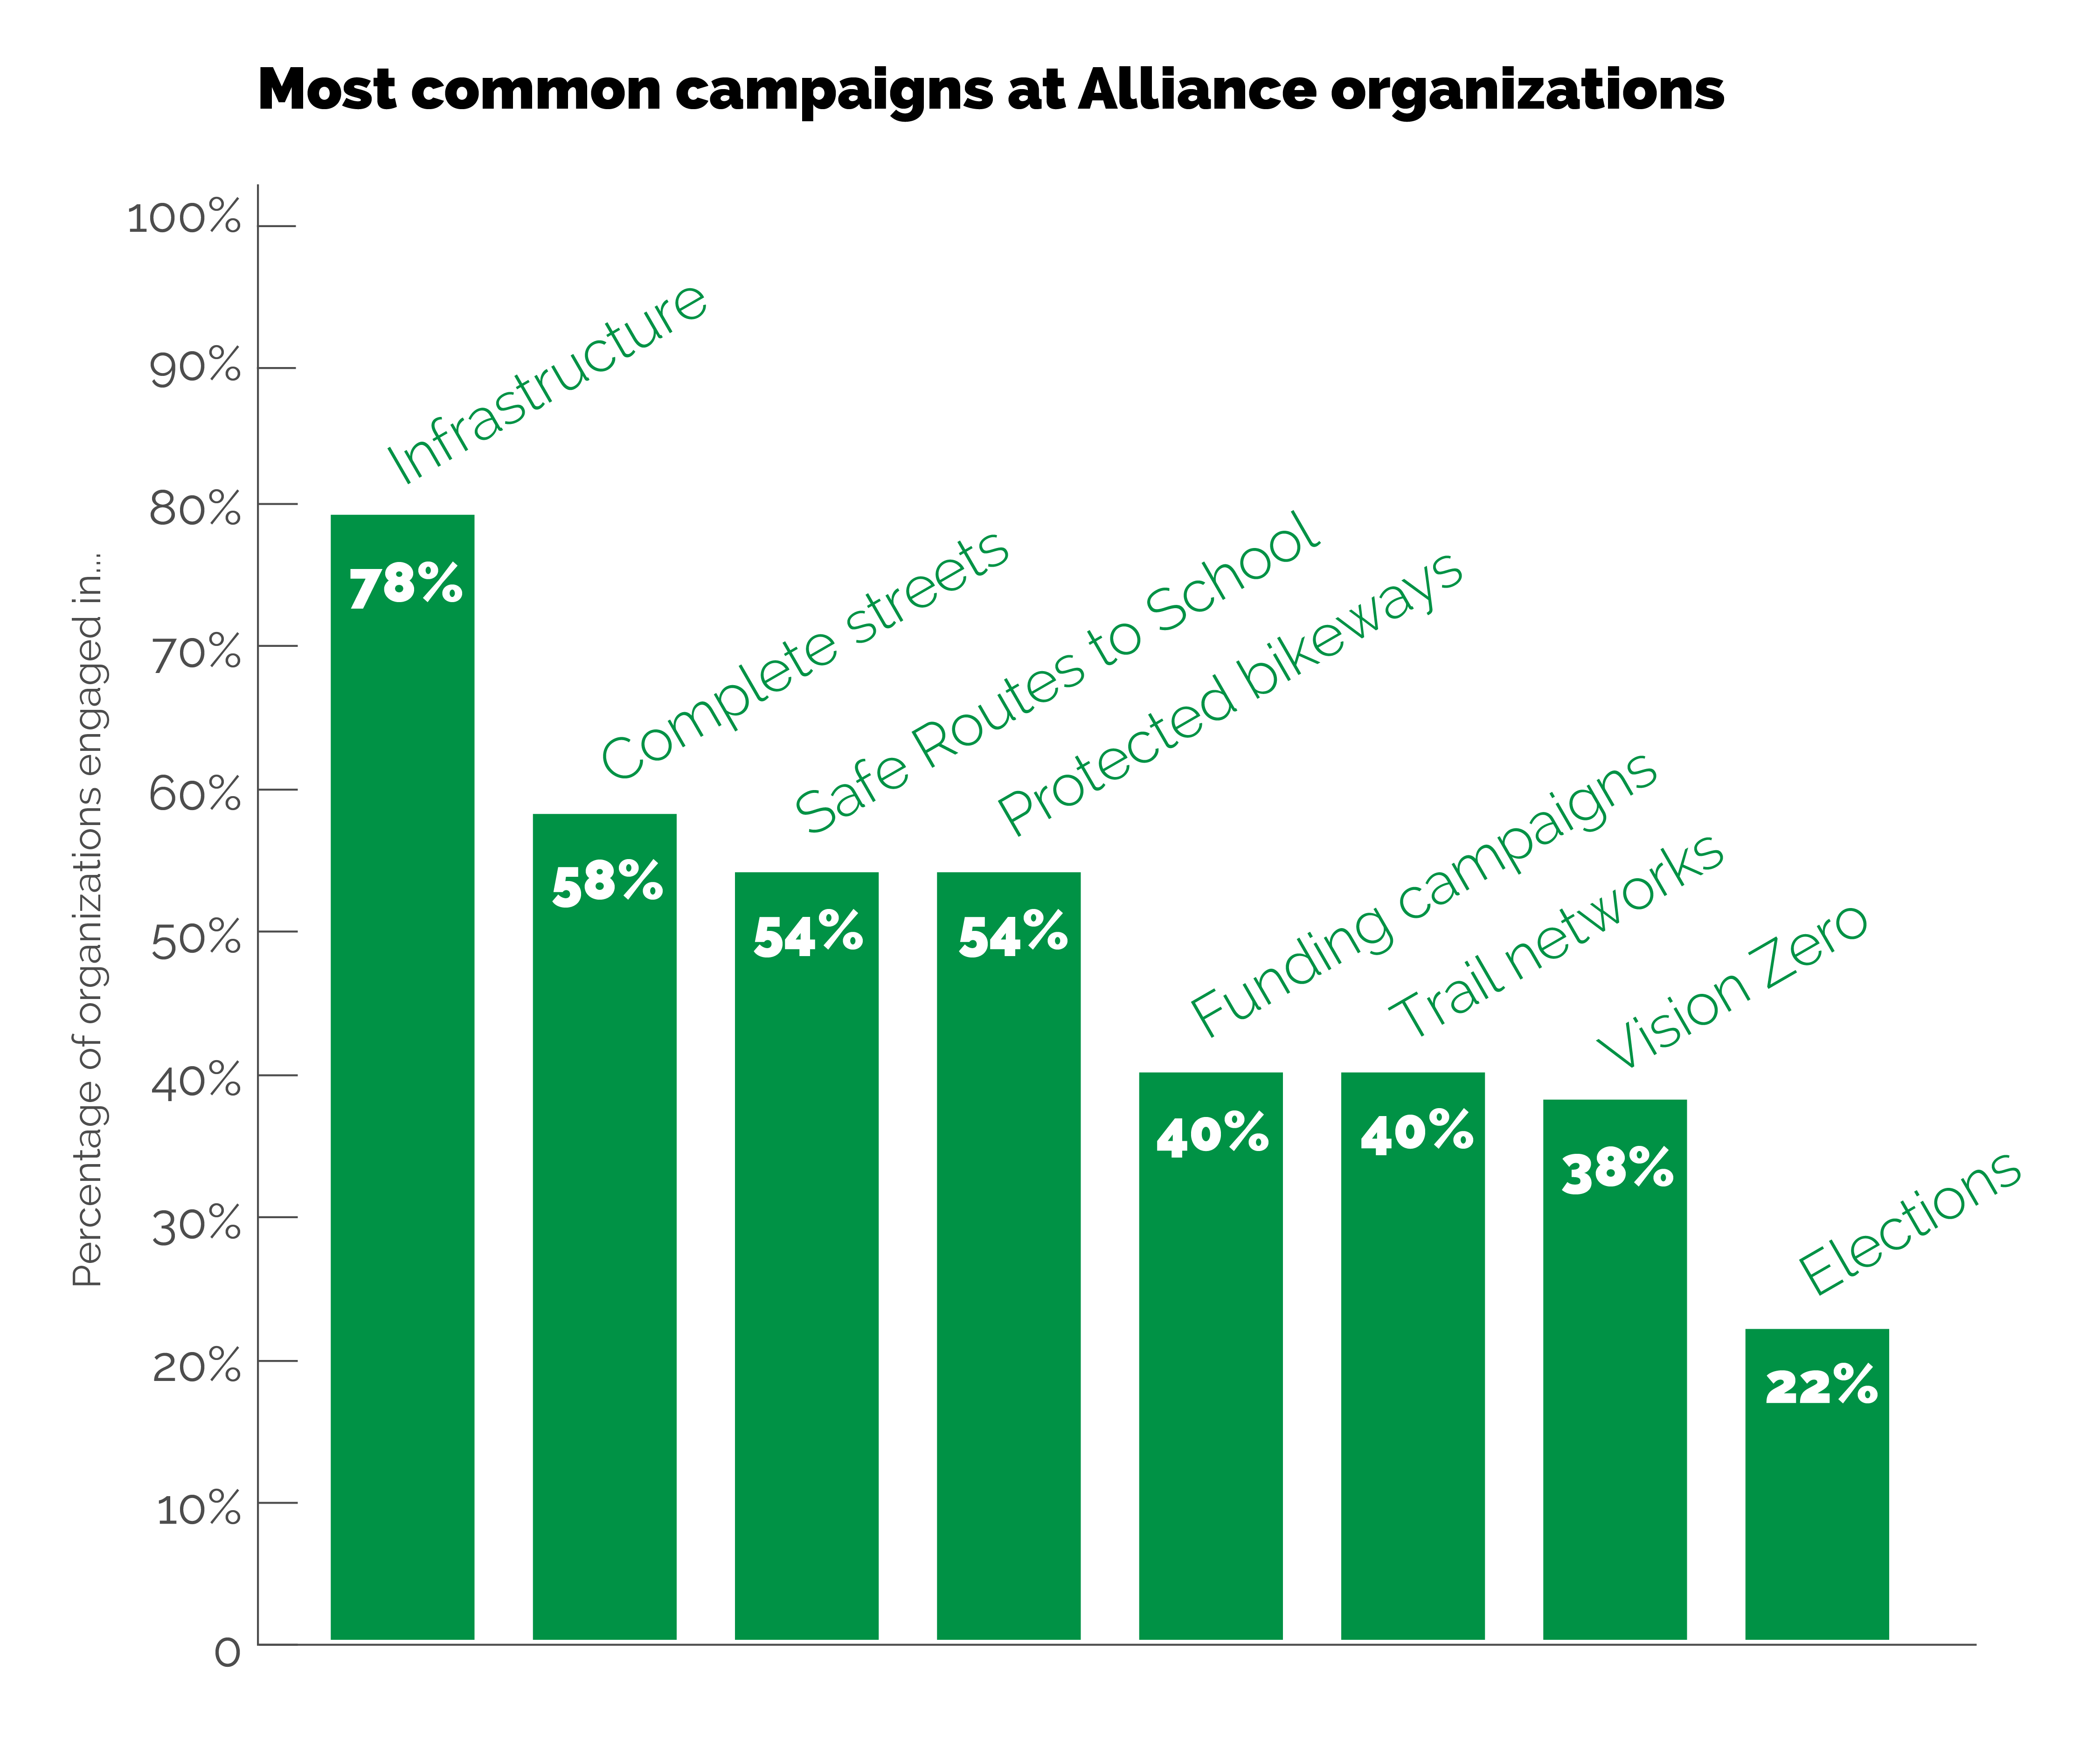
Over the past two decades, the capacity of advocacy organizations has skyrocketed. Overall, Alliance members organizations reported a collective $88 million in budgets in 2014 — a remarkable leap from the $10,000 total budget reported by Alliance members in 1996. Over the same timeframe paid staff at those organized exploded from 12 to more than 1,100.
Interestingly, an Alliance survey of advocacy organizations found that infrastructure campaigns and complete streets were among the most common areas of work; meanwhile the number of complete streets policies at the city and state levels have increased more than three-fold since 2007 and infrastructure — as noted above — has increased, as well.
The State of the Movement found that women and people of color are underrepresented at the staff and board level for the vast majority of bike/walk advocacy organizations. Energy and attention is increasing in communities nationwide to diversify the leadership of the movement and integrate equity into advocates’ work in an authentic and meaningful way.